
How We Use Historical PG&E and SMUD Rates to Project Your Future Energy Costs
When we put together an energy savings estimate for a client, we have to anticipate what electricity will cost in the future in order to give an accurate estimate. Historically, electricity rates have increased, and that’s unlikely to change. If your average monthly bill this year is $200, next year it’ll increase by a few dollars, a few more the next, and so on. It may drop by a few dollars occasionally, but in the long term, your billing rate will increase.
How Utility Rate Increases Impact Solar Savings Projections
To correctly calculate how much money you can save with a solar power system—and thus determine if it makes financial sense for you—we need to be able to anticipate those rate increases. Otherwise, we’ll underestimate future electricity costs, and how much money you’ll save with a solar power system.
But this allows unscrupulous solar contractors to pad savings estimates, and thus make it seem like a solar power system makes financial sense, when in fact you won’t save as much as they claim. Or they may use skewed data to suggest their system will offer better savings than a competitor’s. Let’s explain with an example.
You have an average power bill of $300 per month. You get estimates from solar companies A and B. The two companies’ systems have identical specifications, and both say their systems will cut your energy bills by 75%. But company A says their system will save you $74,726 over the next 20 years, while company B says they can save you $93,742, or about $19,000 more. But everything about the systems is the same! Where’s the difference coming from?
In this case, company A estimated that your utility company would increase their rates by an average of 3% per year, while company B estimated that rates would increase by 5% per year. If the companies used the same annual increase rate (we refer to it as the “utility inflation rate”) they would generate identical estimates of your potential energy savings.
There are two key takeaways from this:
- If you want to make an apples-to-apples comparison between estimates from multiple contractors, try to get all of them to give you a projection based upon the same inflation rate.
- If you want an accurate estimate of your potential savings—whether you’re deciding if solar is right for you, or just because you want to know your future energy costs—you’ll need to know the rate at which your utility company has historically increased their electricity rates.
Thankfully, if you’re a PG&E or SMUD customer, we can help you with that.
Historical PG&E Electricity Rate Increases
PG&E has a massive number of rate plans, and the various usage tiers and other variables makes it challenging to calculate historical rate increase trends. This is complicated by the fact that PG&E is currently shifting customers over to time-of-use (TOU) plans. If you’re currently on a fixed-rate plan, we’ll have to make some rough estimates based on your habits to anticipate what your energy costs will be like under a TOU plan, and then project future rates from there.
It is pretty challenging to develop a forecast for TOU plan rate increases, because there are a lot of different prices to consider: peak hour, off-peak hour, part-peak hour, summer versus winter rates, baseline and over baseline charges, and so on. Another factor making historical analysis difficult is the fact that PG&E has dropped some popular rate plans, such as their E-7 TOU plan, while rolling out others, like their E-TOU-A and E-TOU-B plans.
But PG&E has continually offered the E-6 TOU plan since 2008, which gives us a long-term trend to analyze:
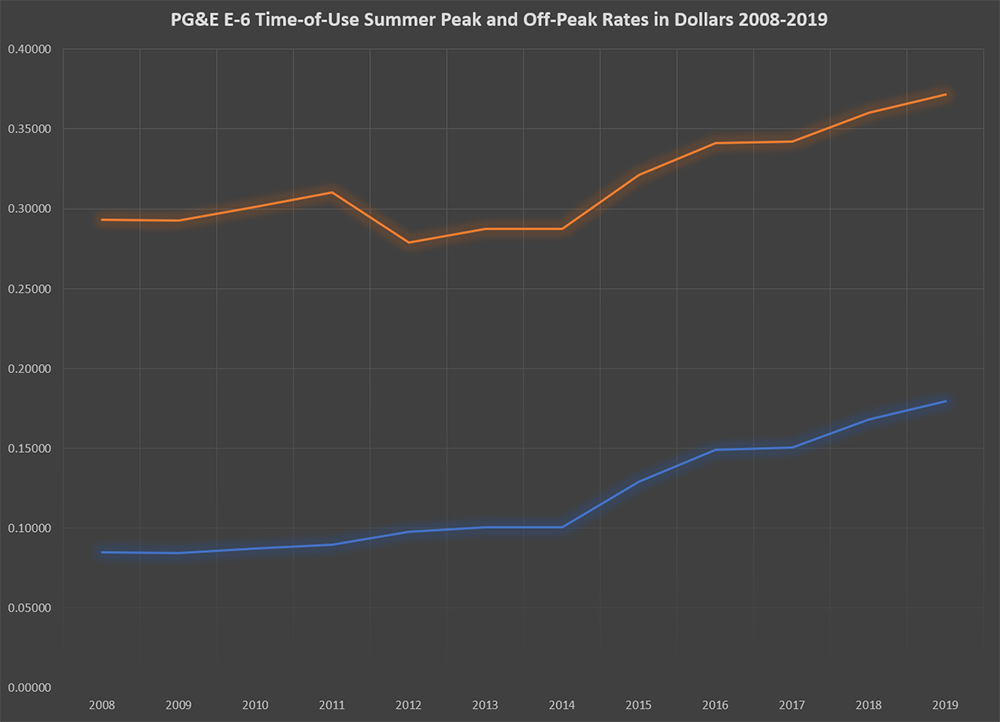
The PG&E E-6 plan’s off-peak summertime rates have more than doubled, from 8.5 cents in 2008 to nearly 18 cents in 2019. Meanwhile, their peak rates have also increased, from 29.3 cents to 37.1 cents. The off-peak rate increased by over 100% in 11 years, while the peak rate increased by 26.6%.
For our purposes, just calculating the yearly inflation rate for off-peak hours will probably suffice for getting a general idea of PG&E’s inflation rates:
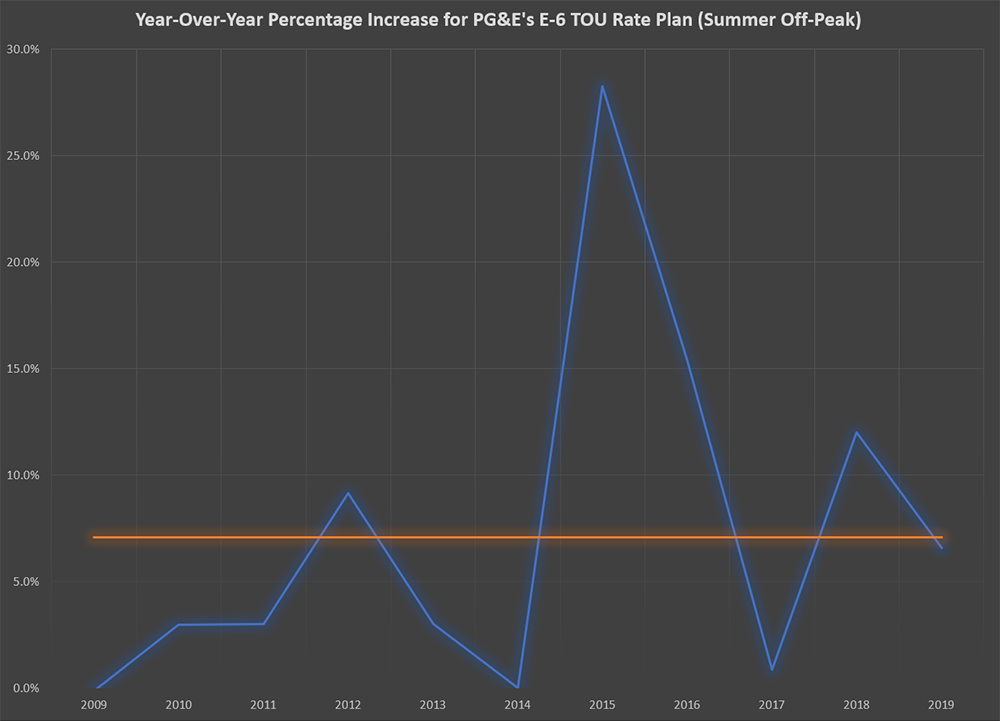
As you can see, rate increases have been sporadic, as was the case with PG&E’s tiered rate plans, with yearly increases ranging between -0.2% and 28.2%. The average yearly increase, which is what we would use for an energy cost forecast, was 7.1%. This means that if your electricity bill is currently $300, we would expect you to pay about $596 per month in 10 years, and nearly $1,200 per month in 20 years. But in generating a cost savings estimate for you, we’ll likely play it a little more conservative with the annual inflation rate, as we would rather underestimate your potential savings, rather than risk overpromising and end up underdelivering.
Historical SMUD Electricity Rate Increases
SMUD has only offered a time-of-use plan for a couple of years, but by looking at their fixed-rate plan, we can get a rough idea of what to expect from their other plans. The fixed-rate plan has summer and winter rates, and since 2012, their winter rates have stayed relatively stable, while summertime rates have more than doubled from 7.6 cents in 2012 to 16.5 cents in 2019.
Overall, the average inflation rate of the plan has been 6.6%, a bit lower than PG&E’s. If your monthly bill averaged $300 this year, we would expect you to pay $568 in 10 years, and $1,077 in 20 years.
While it’s inevitable that electricity rates will continue to rise, it’s much harder to say exactly how much your electricity bill will increase over time. Everyone’s energy habits are different. Peak rates for PG&E’s time-of-use plans aren’t rising as quickly as their off-peak rates, so if you use more electricity during high-demand periods, your bills may not increase as quickly as another customer’s.
That’s why, if you’re considering going solar, that it’s important to sit down with someone who will analyze your energy usage in detail, give you a savings projection tailored to your unique habits, and answer your questions you have. And that’s our specialty. Give us a call or send us a message, and we’ll be happy to schedule an appointment where we can answer all of your questions and explain how you can get the most out of a home solar power system.